This research will be presented at the Carnegie Mellon Sports Analytics Conference and Midwest Sports Analytics Meeting.
Getting cut after pools is probably one of the worst feelings at a national tournament. It hurts to travel hundreds of miles to an event and only get to fence a handful of 5-touch bouts. Sometimes after being cut, I’m discouraged and fence poorly in my next event, but most of the time I’m upset with myself and fence better.
Before 2021, there was no elimination after pools in youth events. Even if you lost all of your bouts you would get to fence in the direct elimination table. Likely due to increasing event sizes, and potentially due to capacity concerns related to the COVID-19 pandemic, USA Fencing added a bottom 20% cut after pools in Y-12 and Y-14 at the 2021 Summer Nationals. The new rule sparked debate among parents, with some arguing it added unnecessary stress for young fencers.
While there isn’t enough data from youth events post-2020 to measure the specific impact on young fencers, this raises an important question about the tournament system in general: Does being cut after pools have a significant psychological effect on fencers’ performance in future events?
The methodology: regression discontinuity
I recently attended the Northwestern Workshop on Research Design for Causal Inference, where I learned about a causal inference methodology called regression discontinuity. It’s a quasi-experimental methodology that compares individuals just below and above an arbitrary threshold to measure the causal effect of crossing that threshold. It has a fancy name, but it’s pretty simple in principle. Here’s why it works for our fencing study:
Arbitrary elimination threshold: USA Fencing cuts the bottom 20% of fencers after pools in most events. But why 20%? It could just as easily be 15% or 25%. This number is pretty much arbitrary—it’s just chosen to keep tournaments manageable.
Luck plays a role in pools:
- Referees sometimes make mistakes
- Fencers can get lucky and unintentionally counteract their opponent’s actions
- Pool assignments are somewhat random.
The pool results and who gets eliminated aren’t just about skill—there’s an element of luck in the mix too.
Fencers near the cutoff are very similar: Because of the arbitrary cutoff and the luck factor, fencers who barely made it past pools are probably very close in skill level to those who barely got cut. Perhaps if they had different referees, the results would reverse around the cutoff!

Implementing regression discontinuity
Pre-specified parameters
Null hypothesisnull hypothesis a statement in statistical testing that posits no significant difference or relationship between variables, serving as the baseline assumption until evidence suggests otherwise.: there is no effect of being cut on performance
Alternative hypothesisalternative hypothesis a statement that posits there is a relationship or difference between variables, contrasting with the null hypothesis and tested to determine if it can be supported by evidence: there is an effect of being cut on performance (two-sided test)
Significance level: α = 0.05
Subgroups analyzed: weapons, genders
- We examine fencers’ performance in their Cadet event after a Junior event where they either barely made the cut or were barely eliminated.
- Performance is measured by pool result percentile, with the #1 ranked fencer at the 100th percentile and the last place fencer near the 0th percentile. By definition, fencers below the 20th percentile in their Junior event are cut after pools.
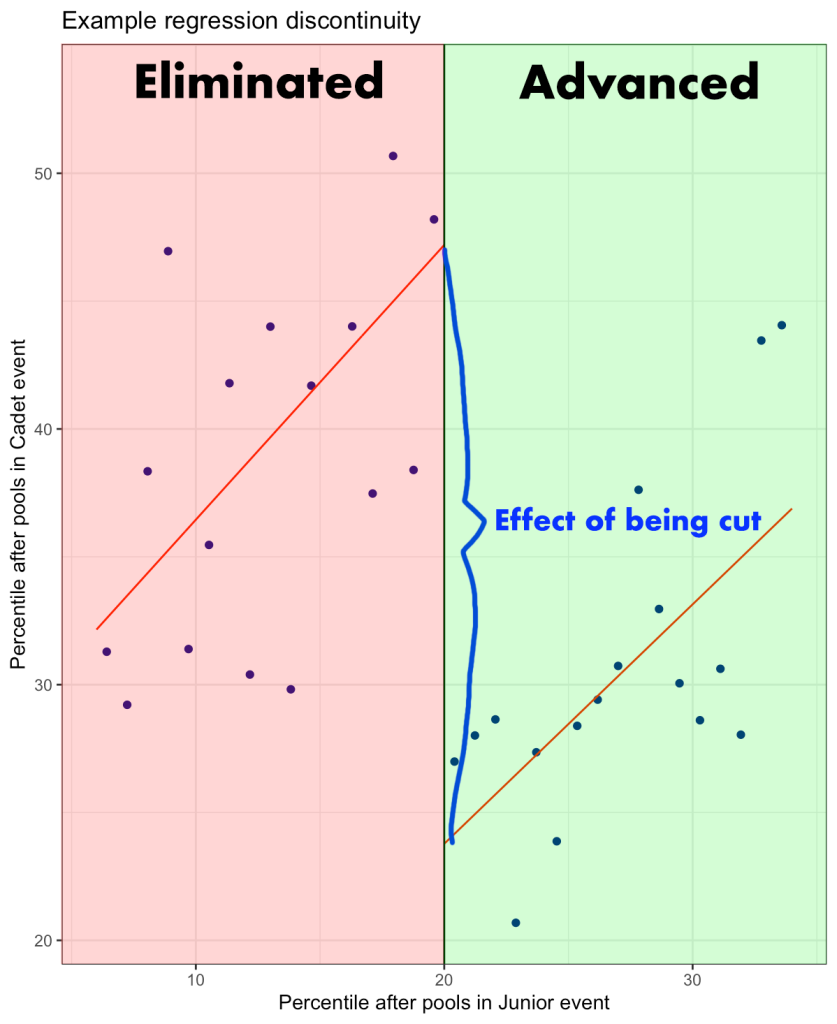
- We plot fencers’ Cadet performance against their performance in Juniors. Then we fit lines through the data points on each side of the cutoff. Here is an example of what that could look like:

- A significant jump or drop at the cutoff suggests that elimination affected future performance. In the illustrative example above (using simulated data), fencers who get cut in Junior do better in Cadet, placing about 25 percentile higher.
This analysis was implemented using the rdrobust [1] package, which automatically selects a bandwidth—the range of data around the cutoff point we analyze [2]. As a result, the findings are most relevant to fencers close to the elimination threshold and may not apply to those far above or below the cutoff.
Results
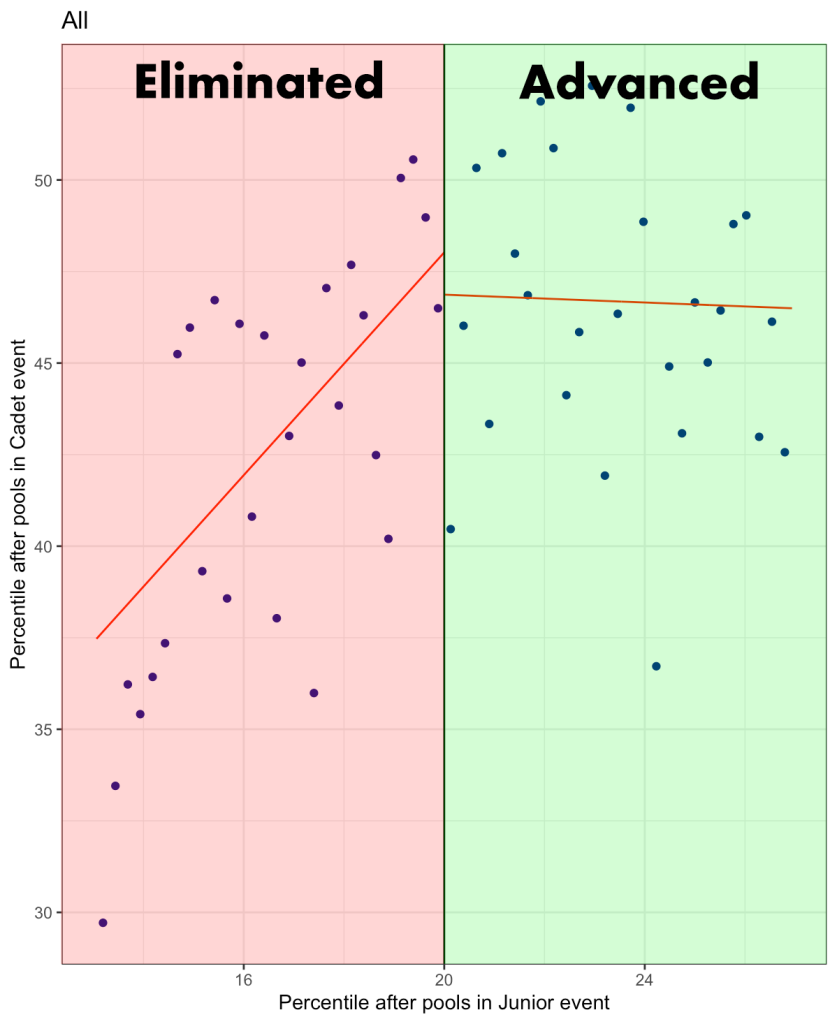
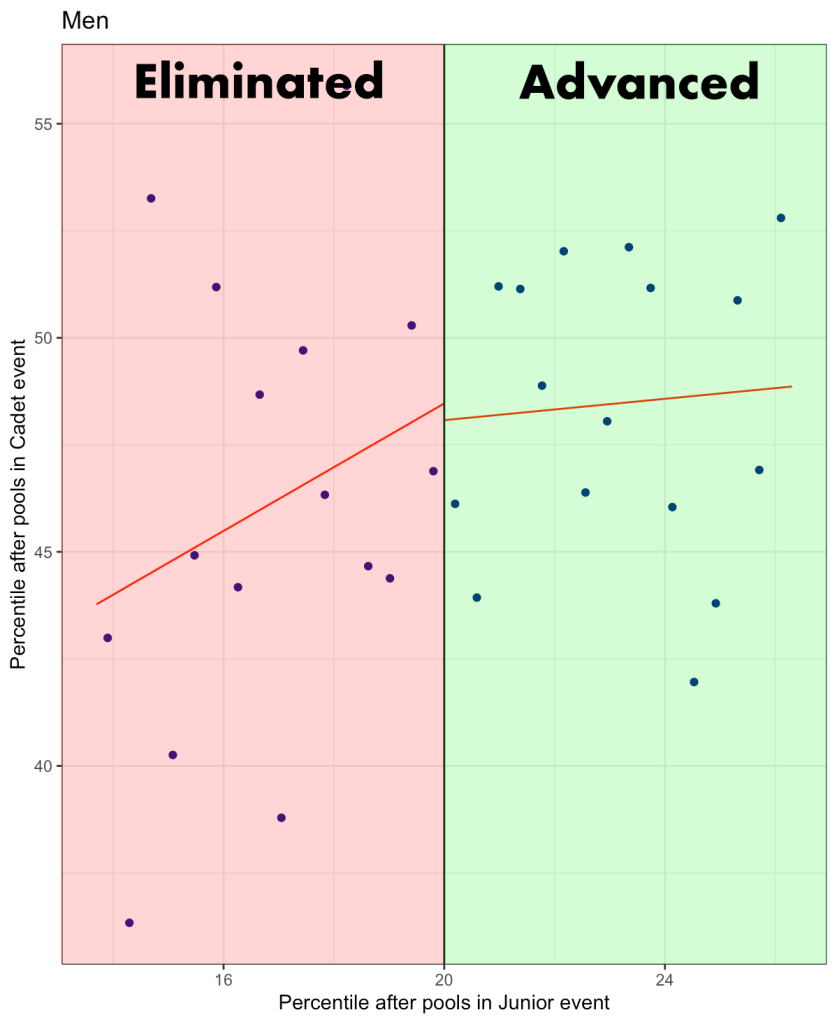
The analysis, based on actual data from a sample of 8,817 fencers collected from USA Fencing tournaments between 2012-2020, yielded unexpected results. I found no clear evidence that fencers who narrowly missed the cutoff performed any better or worse in subsequent events compared to those who just made it. This suggests that being eliminated after pools may not have a significant impact on a fencer’s performance in their next event
Overall Impact
Across all weapons and genders, the effect of being cut after pools was a tiny increase of 1.2 percentile in subsequent performance. However, with a p-value of 0.680, this result is not statistically significantstatistically significant a result in statistical testing that provides enough evidence to reject the null hypothesis, suggesting that an observed effect is likely not due to chance alone, meaning the observed difference could be due to random chance rather than a true effect. You can read more about p-values and their advantages and disadvantages here.
Gender-Specific Analysis
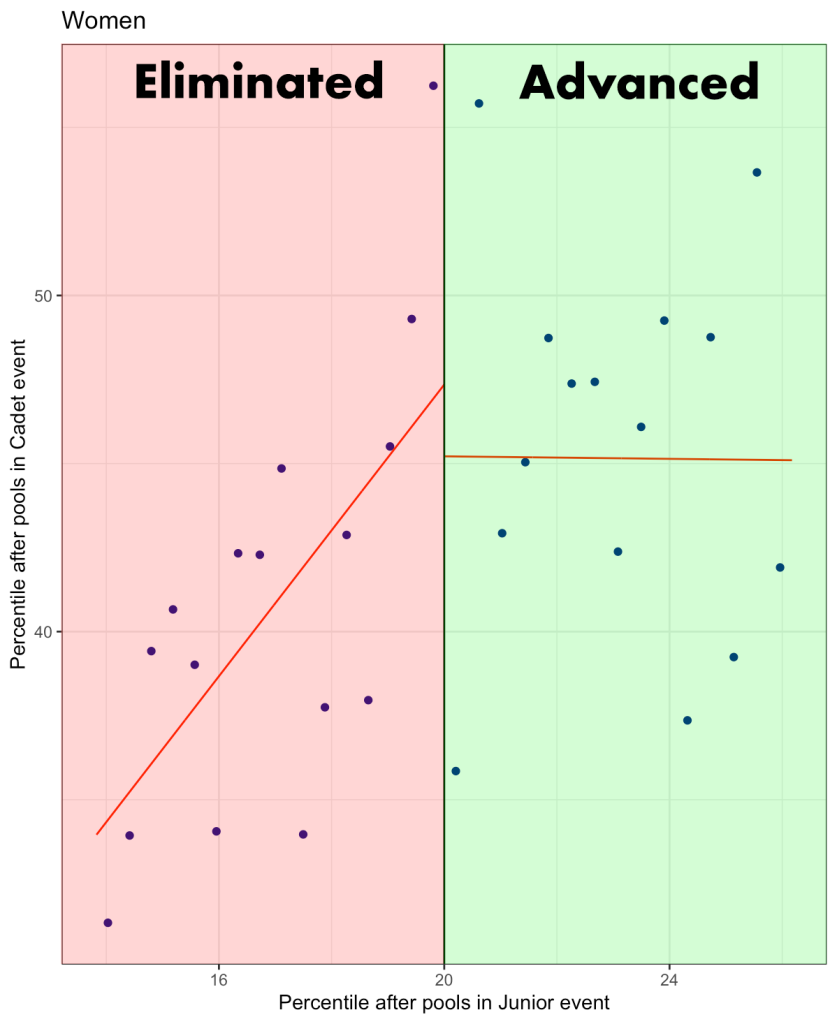
Some research [3] suggests men and women may respond differently to not making the cutoff in competition. My gender-specific analysis showed no evidence of this, as all p-values were above 0.05.
- Women: Slight positive effect of being cut (2.1 percentile, p-value = 0.481)
- Men: Negligible positive effect of being cut (0.4 percentile, p-value = 0.996)
Weapon-Specific Results
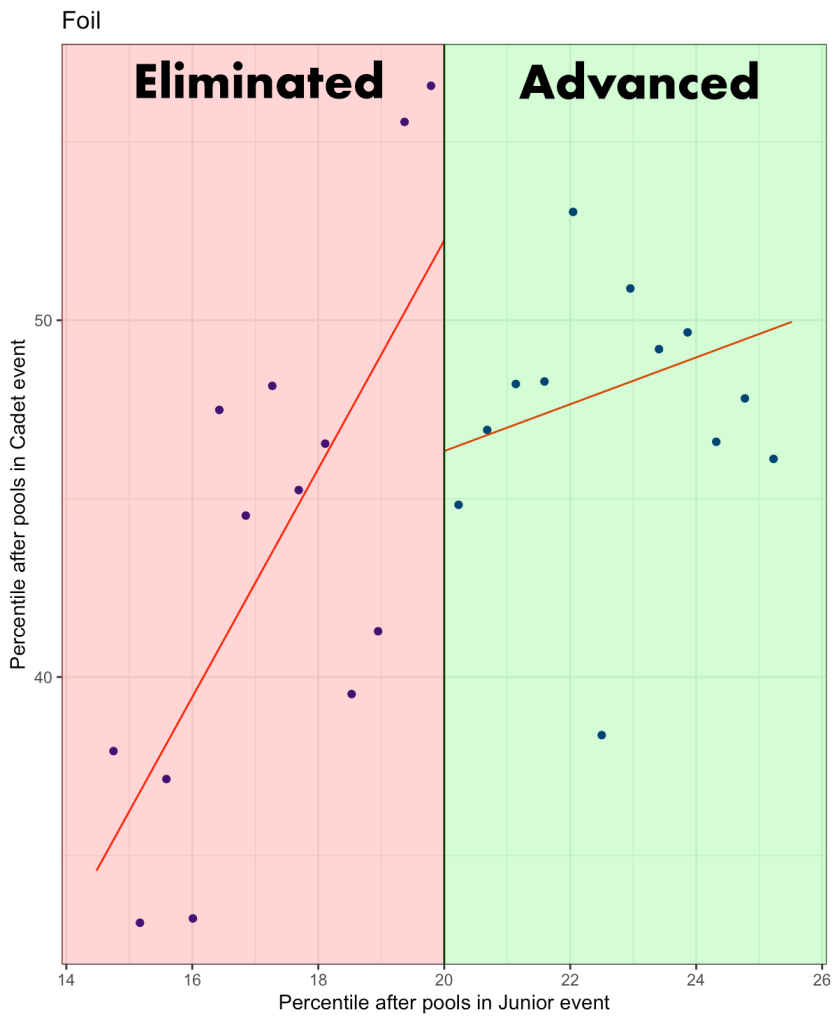
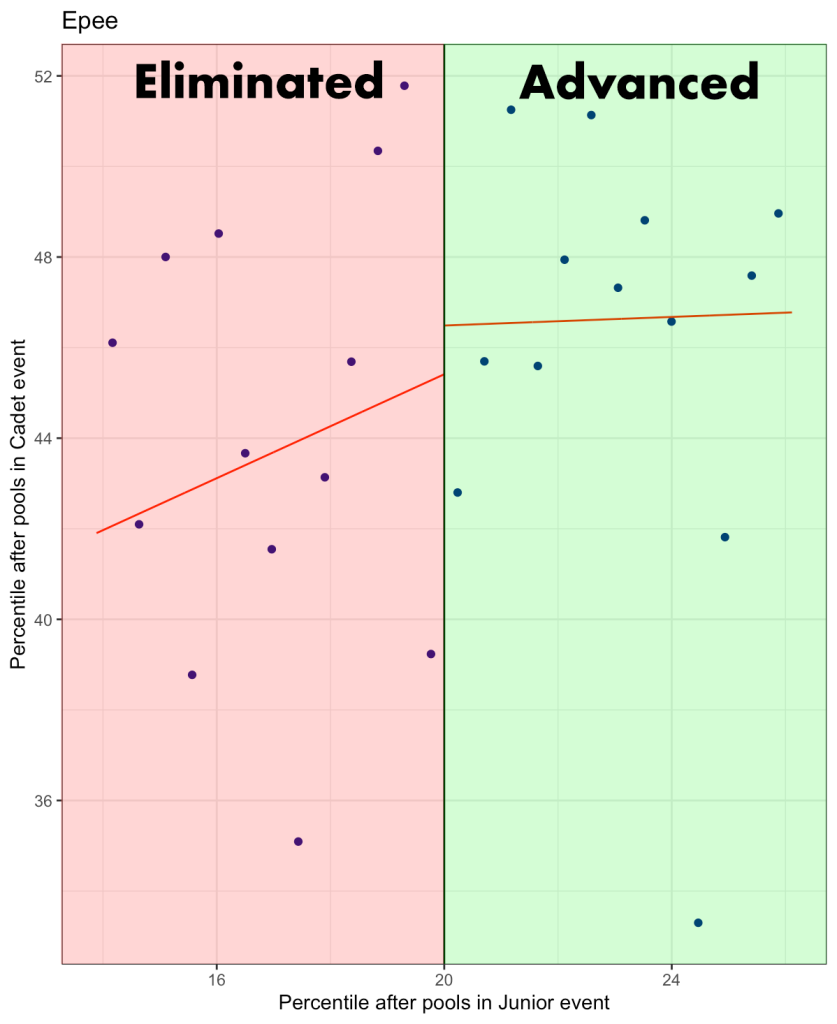
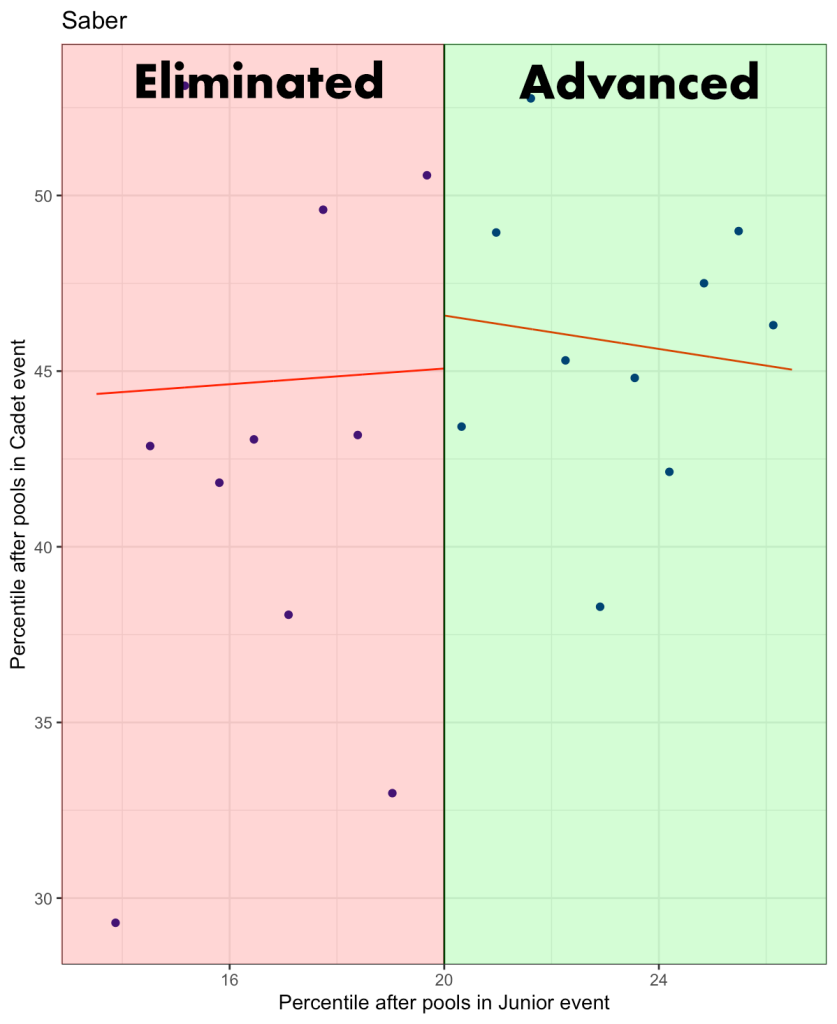
Considering that different weapons might attract different personality types, I examined each weapon individually. Again, all of the results were nonsignificantnonsignificant a result in statistical testing that does not provide enough evidence (often a p-value < 0.05) to reject the null hypothesis, suggesting that any observed effect may be due to chance, with p-values above 0.05. Therefore there is no evidence of the cut having an effect on future performance for any specific weapon.
- Foil: Small positive effect of being cut (5.9 percentile, p-value = 0.164)
- Epee: Slight negative effect of being cut (-1.1 percentile, p-value = 0.860)
- Saber: Slight negative effect of being cut (-1.5 percentile, p-value = 0.597)
Conclusion
My investigation into the impact of the 20% cut on future fencer performance yielded interesting results. Contrary to what I initially expected, I found no evidence that being eliminated after pools negatively affects a fencer’s performance in subsequent events. This held true across individual genders and weapons. However, it’s also important to note that a lack of significant results doesn’t necessarily mean there’s no effect of being cut; it may simply be too small to detect with the current sample sizesample size the number of individual observations or data points collected from a population for use in statistical analysis or experimentation or methodology.
One possible explanation for the insignificant results is that fencers who get cut may be psychologically affected, but have more energy for their next event compared to fencers who did not get cut and had to fence a direct elimination bout. However, it’s relatively uncommon for fencers who just made the cut to win their first DE bout, so the impact of one bout on their energy level is probably minimal.
I must emphasize that this study focused on performance metrics for a specific age group. While being cut in Junior events doesn’t seem to affect future results for Cadet fencers, these findings shouldn’t be extrapolated to younger fencers (Y-12 and Y-14) without dedicated studies for those age groups.
For USA Fencing, these results might provide some reassurance about the use of post-pool cuts to manage large events. This data suggests that such cuts may not harm fencers’ later performance in the tournament.
What’s your take on these findings? Whether you’re a fencer, coach, or parent, I’d love to hear your thoughts and experiences.
References
[1] Calonico S, Cattaneo M D, Titiunik R. Rdrobust: An R package for robust nonparametric inference in regression-discontinuity designs. The R Journal. 2015;7(1):38. doi:10.32614/rj-2015-004
[2] Calonico S, Cattaneo MD, Farrell MH. Optimal bandwidth choice for robust bias-corrected inference in regression discontinuity designs. The Econometrics Journal. 2019 Nov 12;23(2):192–210. doi:10.1093/ectj/utz022
[3] Fang C, Zhang E, Zhang J. Do women give up competing more easily? Evidence from speedcubers. Economics Letters. 2021 Aug;205:109943. doi:10.1016/j.econlet.2021.109943
